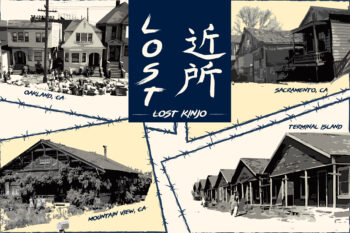
 A comprehensive report on the State of Asian Americans and Pacific Islanders from the Center for American Progress paints a comprehensive picture of that community (Photo by US Army RDECOM)
The report by Karthick Ramakrishnan and Farah Ahmad breaks down into four categories–public opinion , demographics, education and immigration.
In the area of public opinion, 55 percent of Asian Americans surveyed favor a bigger role and more services from government compared to just 39 percent nationally.
67 percent of Asian Americans support tax increases for higher wage earners. This only drops to 62 percent among Asian Americans earning more than $250,000.
69 percent self identify as environmentalists and 58 percent would choose environmental protection over economic growth.


37 percent of Asian Americans identify school bullying as a serious problem with 71 percent of Hmong, 52 percent of Indian Americans and 46 percent of Filipino Americans also believing that.
58 percent of Asian Americans support a pathway to citizenship and 50 percent support the Affordable Care Act or Obamacare.
Asian Americans are also more open to diversity than other groups, ranking higher than on many questions of diversity than African Americans, Latinos and whites.
You can get a further breakdown of these results by specific ethnicity including Chinese, Filipino, Indian, Japanese, Korean, and Vietnamese here. For some questions, there are also breakdowns for Native Hawaiians, Pacific Islanders and Hmong.
In the area of demographics, Asian Americans remain the fastest growing ethnic group in the country growing 10 percent in the last three years and 46 percent in the last decade. Pacific Islanders are the second fastest growing ethnic group increasing 7 percent in the last three years and 40 percent in the last decade.
The six largest Asian American subgroups comprise 85 percent of that community. They are from largest to smallest Chinese, Filipino, Indian, Vietnamese, Korean, and Japanese. The population of Filipino and Indian Americans is almost equal with Indian Americans growing at a much faster rate in recent years.
The report also includes breakdowns for a number of smaller groups including Pakistani, Cambodian, Hmong, Thai, Laotian, Taiwanese, Bangladeshi, Burmese, Indonesian, Nepalese, Sri Lankan, Malaysian, Mongolian, Bhutanese and Okinawan.
There are also break out for Pacific Islanders including Samoan, Guamanian or Chamorro, Tongan, Fijian and Marshallese.
In the category of immigration, Asian Americans have the greatest proportion of immigrants than any other group. The percentage of naturalized American citizens originating from Asian countries has outpaced all other regions of the world every year in the past decade except 2008 and 2012.
Asian countries dominate the list of most people waiting for family visas with the Philippines, India, Vietnam and China all in the top 5 and trailing Mexico.
The growth in the Asian American population is also reflected in our education system with AAPI enrollment in k-12 increasing four fold between 1979 and 2009. It’s expected to grow another 31 percent by 2019.
29 percent of Asian Americans have bachelor degrees and 20 percent have post graduate degrees. Asian Americans are tops in both categories. But Southeast Asian Americans tend to have the lowest level of educational achievement as do Pacific Islanders.