By Lindsay Wang
A new Pew Research Center study released this morning reveals that most Asian Americans possess favorable views towards their homelands, with the notable exception of Chinese Americans. Other opinions that were surveyed include Asian Americans’ views of countries besides their homelands, of moving back to their homelands, and of what country will be the leading economic power in the next decade.
This report is one of the latest in a series on public opinions of Asian Americans. It includes data collected from 7,006 Asian American adults—the largest nationally representative survey of Asian Americans ever conducted, according to lead author Neil G. Ruiz.
“In our [May 2023] survey, we found that Asian Americans have very similar views as to [the] general U.S. population,” he told AsAmNews. “For instance, in questions of what it means to be truly American, Asian Americans are identical to the general population in accepting people of diverse racial, religious backgrounds, in believing in individual freedoms, in respecting U.S. political institutions and laws.”
“So I think that this report is almost like an extension of that—looking at the views of Asian Americans towards their homelands, which [aren’t] necessarily always favorable,” he continued.
In order to draw insights about specific Asian origin groups, the survey relied on self-identification, with participants either choosing from a set of ethnicities or writing one in. “When it comes to identity, identities can change over time,” Ruiz said. “They’re not static… So we want to make sure we take [the respondents’] word on how they identify, not just based on where they’re born but how they see themselves.”
Despite oversampling for Chinese, Filipino, Indian, Korean and Vietnamese American populations, the survey received large enough sample sizes of self-identified Japanese and Taiwanese American respondents to report on their views as well.
Below are some highlights of the report.
Views of ancestral homelands
While most Asian Americans have a favorable view of their ancestral homeland, Chinese Americans are a notable exception, with only 41 percent expressing somewhat/very favorable opinions of China. In comparison, about nine-in-ten Japanese and Taiwanese Americans say they have somewhat/very favorable views of their own homelands.
A statistic of particular interest is that 62 percent of Chinese Americans have a favorable view of Taiwan, as compared to the 41 percent who view China favorably. Sentiment towards Taiwan varies depending on nativity, however: Chinese immigrant adults are more likely than U.S.-born Chinese adults to view China favorably (45 percent vs. 25 percent) but are less likely to view Taiwan favorably (60 percent vs. 70 percent).
“It’s also probably telling us a little something about migration, right?” Ruiz said. “Especially you see those who’ve been in the United States for … 21 years or longer have the more unfavorable view of China versus those who are more recent immigrants who’ve been less than 10 years, so it also probably reflects reasons why people have migrated. We can’t tell exactly because we don’t have the follow-up questions for them, but it kind of tells you about waves of migration and their different opinions towards, for instance, China or the other countries they came from.”
Meanwhile, 76 percent of Indian Americans have a favorable view of India—three times greater than the 23 percent of Asian Americans as a whole who have a favorable view of India. The next highest favorable ratings come from Filipino Americans, 31 percent of whom view India favorably. Chinese, Korean and Taiwanese Americans have the lowest favorable ratings at 17 percent.
(It is important to note here that low favorability does not necessarily imply high unfavorability—the survey allowed for a gradient of responses ranging from very unfavorable to neither favorable nor unfavorable to very favorable. In this case, while 17 percent of Korean Americans have a favorable view of India, only 30 percent view it unfavorably. 52 percent have neither a favorable nor an unfavorable view of India.)
While a majority of Japanese Americans (53 percent) have a favorable view of South Korea, the sentiment is not reciprocated: only 36 percent of Korean Americans have a favorable view of Japan. The survey speculates that this difference is a result of Japan’s colonial history in South Korea.
Korean American views on Japan vary depending on the strength of their personal ties to the Korean peninsula. U.S.-born and younger (ages 18 to 49) Korean American adults are more likely to have favorable views on Japan, and even among Korean immigrants, those who have been in the U.S. for 21+ years are almost twice as likely to view Japan favorably than those who arrived more recently.
Moving to ancestral homelands
Despite mostly favorable views towards their own homelands, most Asian Americans say that they would not move or move back to their ancestral homelands. Indian Americans have the highest rate of interest in moving to their homeland at 33 percent while Chinese Americans have the lowest at 16 percent.
While it’s possible that travel restrictions due to COVID-19 could have influenced these results, it’s impossible to draw any concrete conclusions. “This is the largest survey of Asian Americans ever conducted—it took a long time,” Ruiz said. “It took from July [2022] to January [2023], and we unfortunately can’t trend from pre-COVID.”
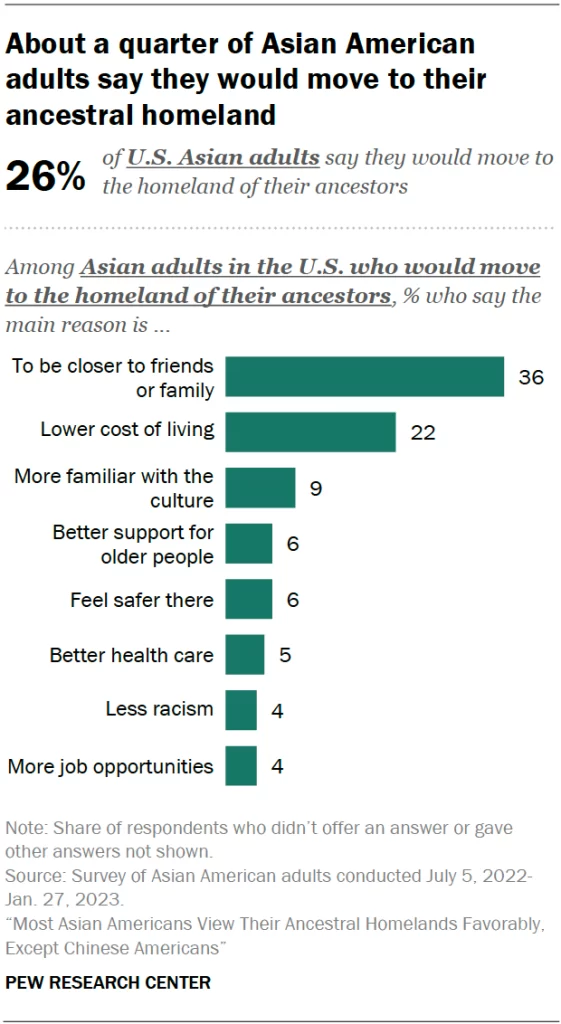
Of the quarter of Asian Americans who say they would move to their ancestral homelands, the top five most commonly cited reasons are:

- To be closer with friends and family (36 percent)
- Lower cost of living (22 percent)
- More familiar with the culture (9 percent)
- Better support for older people (6 percent)
- Feel safer there (6 percent)
The ranking of these reasons varies depending on the Asian origin group: the top reason for Filipino and Vietnamese Americans who would move to their homelands is lower cost of living 47 percent and 35 percent) while the top reason for Chinese and Indian Americans is to be closer to friends and family (27 percent and 52 percent).
Interest in moving to ancestral homelands varies for all Asian Americans by nativity and time spent in the U.S. 26 percent of Asian immigrants would move back versus 14 percent of U.S.-born Asian adults who would move to their ancestral homelands. Within Asian immigrants, about half of those who have been in the U.S. for l0 years or less would move back compared to the one-in-five who have been in the U.S. for more than two decades.
Leading economic power in the next decade

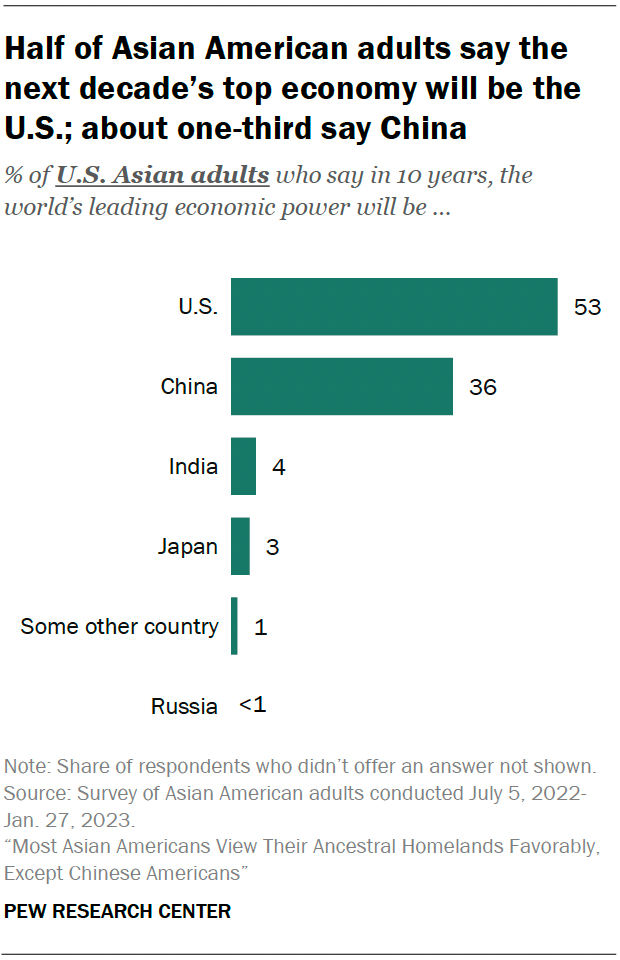
Most Asian Americans (53 percent) say that the U.S. will be the world’s leading economic power within the next 10 years. China ranks at a distant second at 36 percent, with India and Japan trailing at 4 percent and 3 percent respectively.
This view differs by age: 62 percent of older Asian Americans (65+ years old) say that the U.S. will be the leading economic power, whereas only 49 percent of younger Asian Americans (under 50 years old) say the same.
Chinese Americans are more divided than other groups in this view, with 53 percent naming the U.S. as the leading economic power and 40 percent naming China. Indian Americans are the most likely to say that India will be the leading economic power at 15 percent—all other Asian origin groups cap at 2 percent.
Conclusion
Despite some expected and unexpected findings, the true significance of this survey lies in its very existence.
“What’s great about this here is that we have the views of actual Asian Americans,” Ruiz said. “Instead of speculation, we actually have data, and we’ll have data upcoming also on questions on different issues like immigration, issues of representation, issues of economic mobility. Those are going to be upcoming in the future, hopefully in the coming months.”
Support our June Membership Drive and receive member-only benefits. We are 27% of our goal of $10,000 in new donations and monthly and annual donation pledges by the end of the Month.
We are published by the non-profit Asian American Media Inc and supported by our readers along with the Robert Wood Johnson Foundation, AARP, Report for America/GroundTruth Project & Koo and Patricia Yuen of the Yuen Foundation.
You can make your tax-deductible donations here via credit card, debit card, Apple Pay, Google Pay, PayPal and Venmo. Stock donations and donations via DAFs are also welcomed. Contact us at info @ asamnews dot com for more info.


